RU
RUNeurovisor
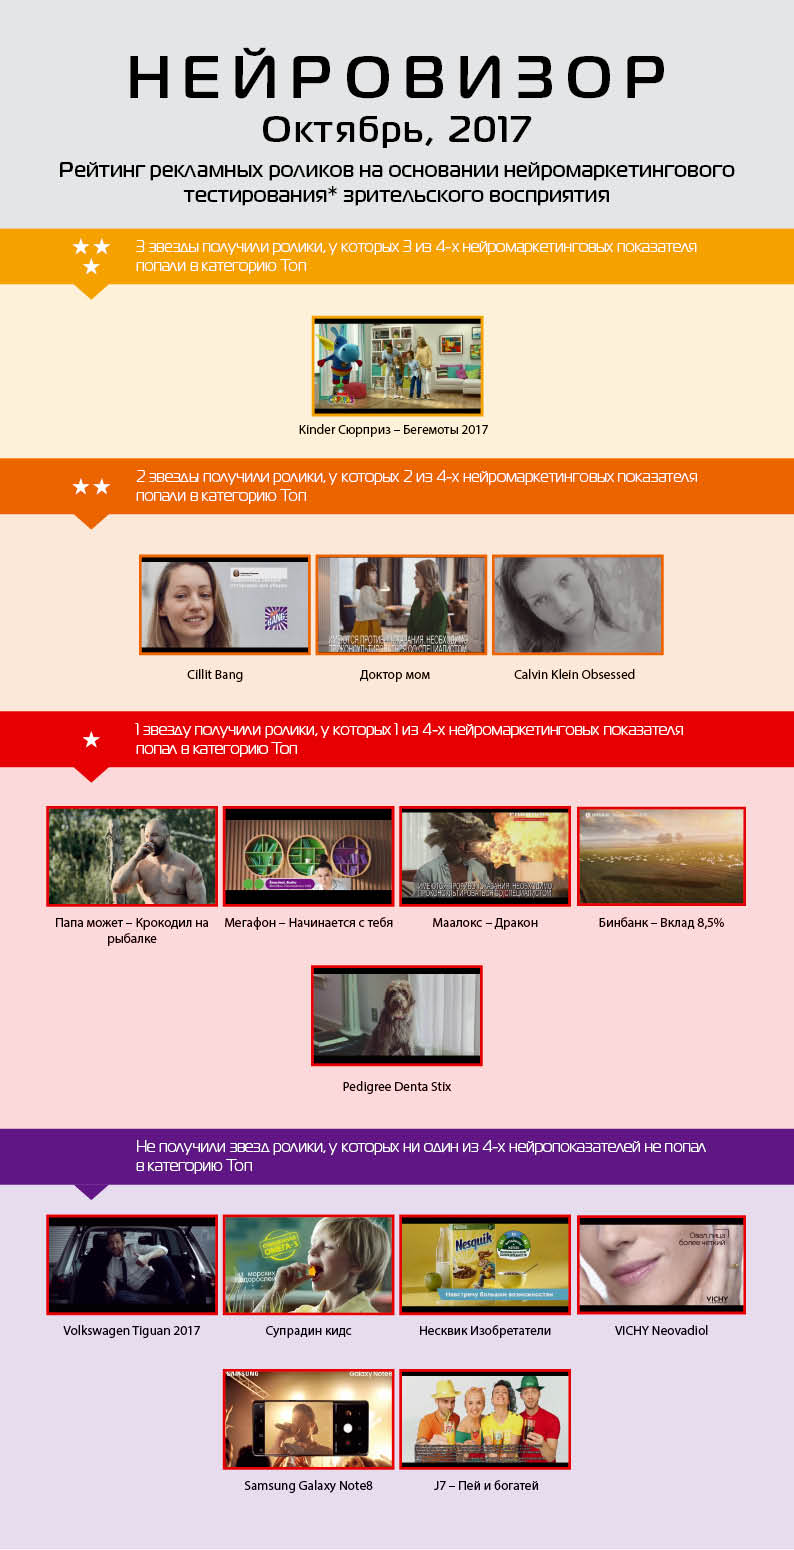
Neuromarketing Rating of Advertising


Neurovisor is a modern analysis of advertising market that reveals the effectiveness of TV ads.
With the help of neuromarketing technologies (EEG, eye-tracker and polygraph), we analyze the reactions of viewers while they are watching the ads and we get objective perception data that traditional marketing researches are not able to provide. We focus on 4 key indicators of the effectiveness: attention, interest, emotional engagement and memory retention.
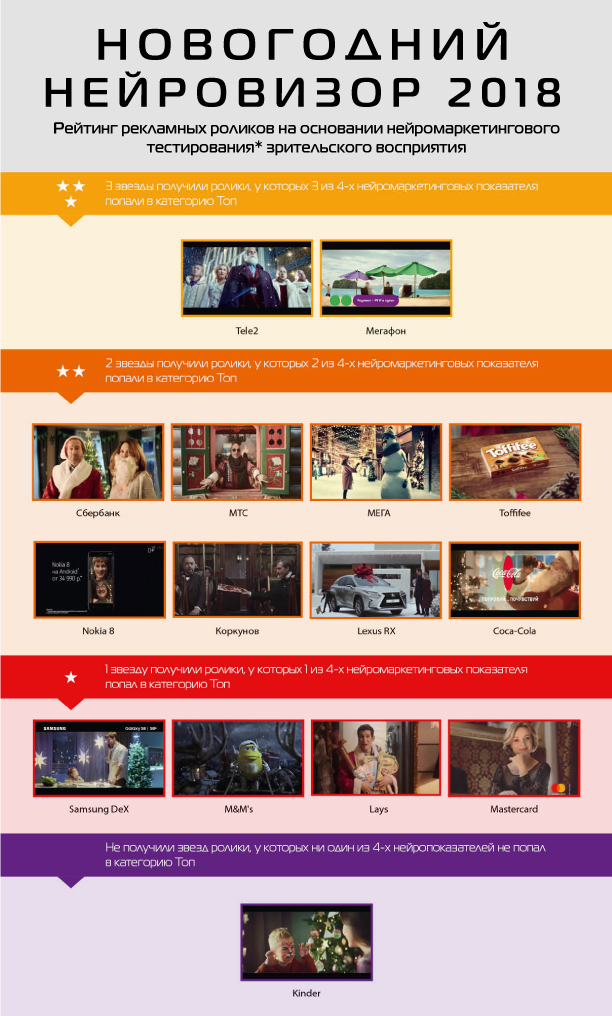
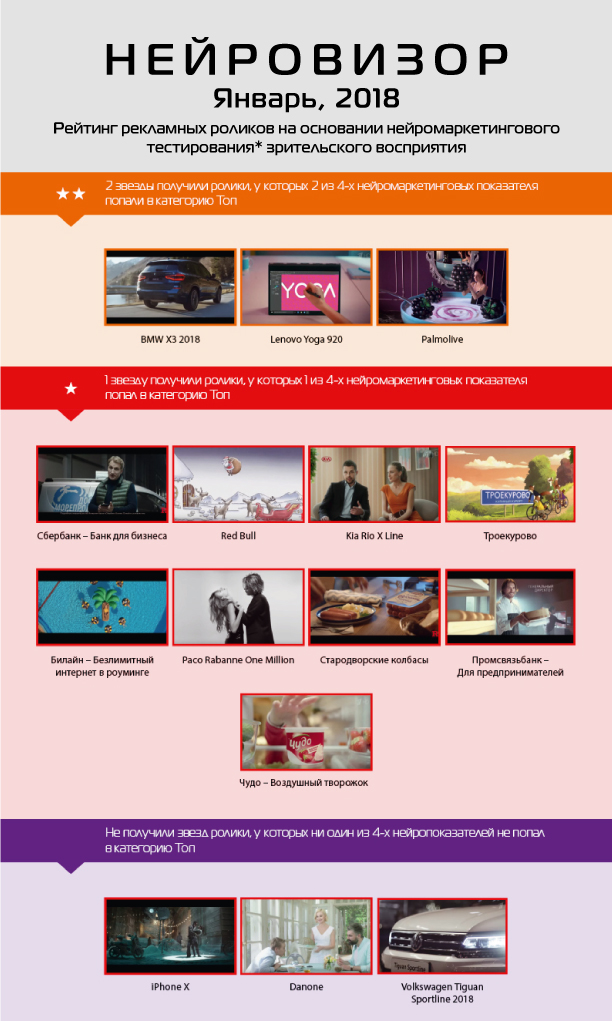
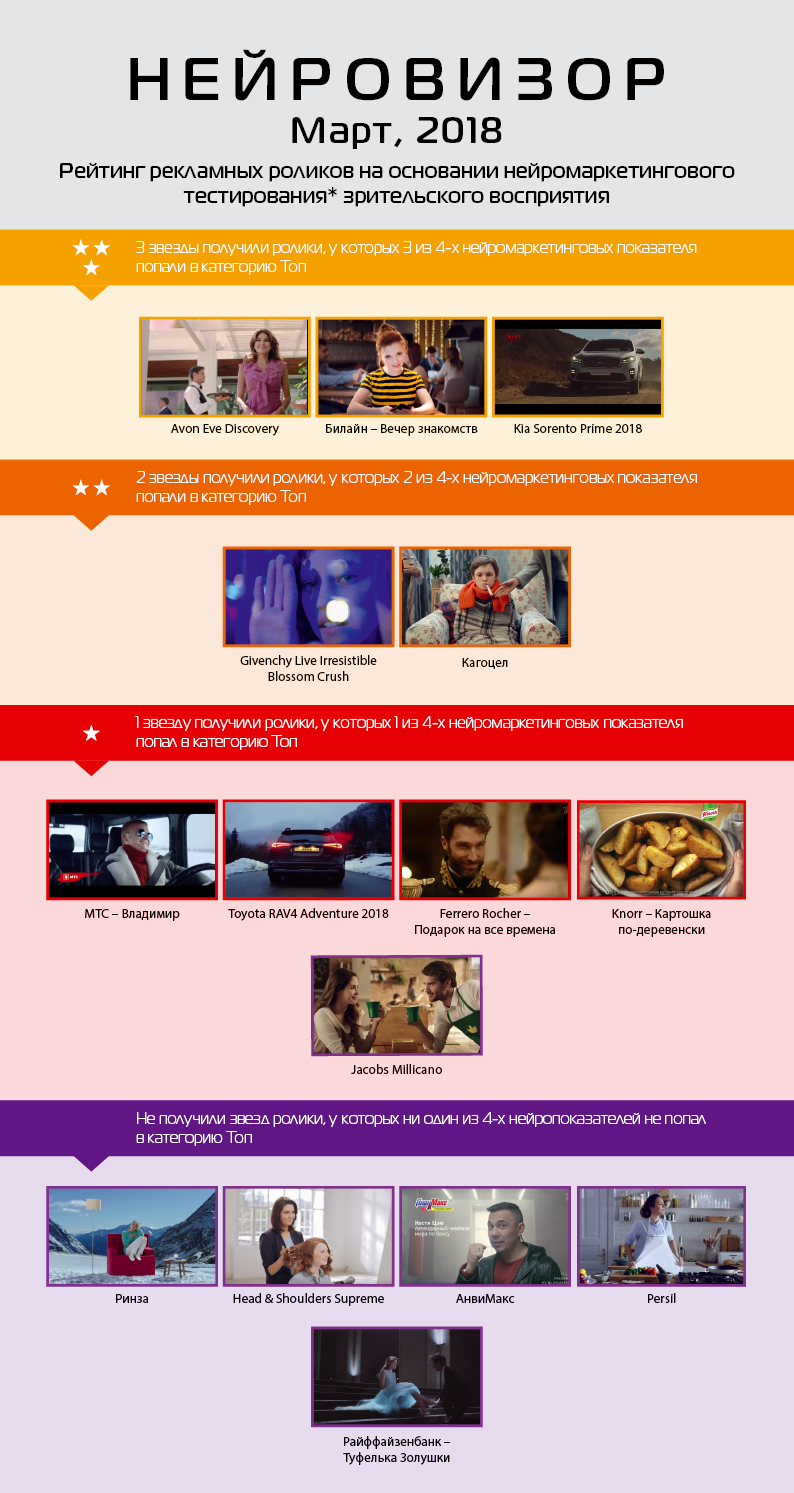
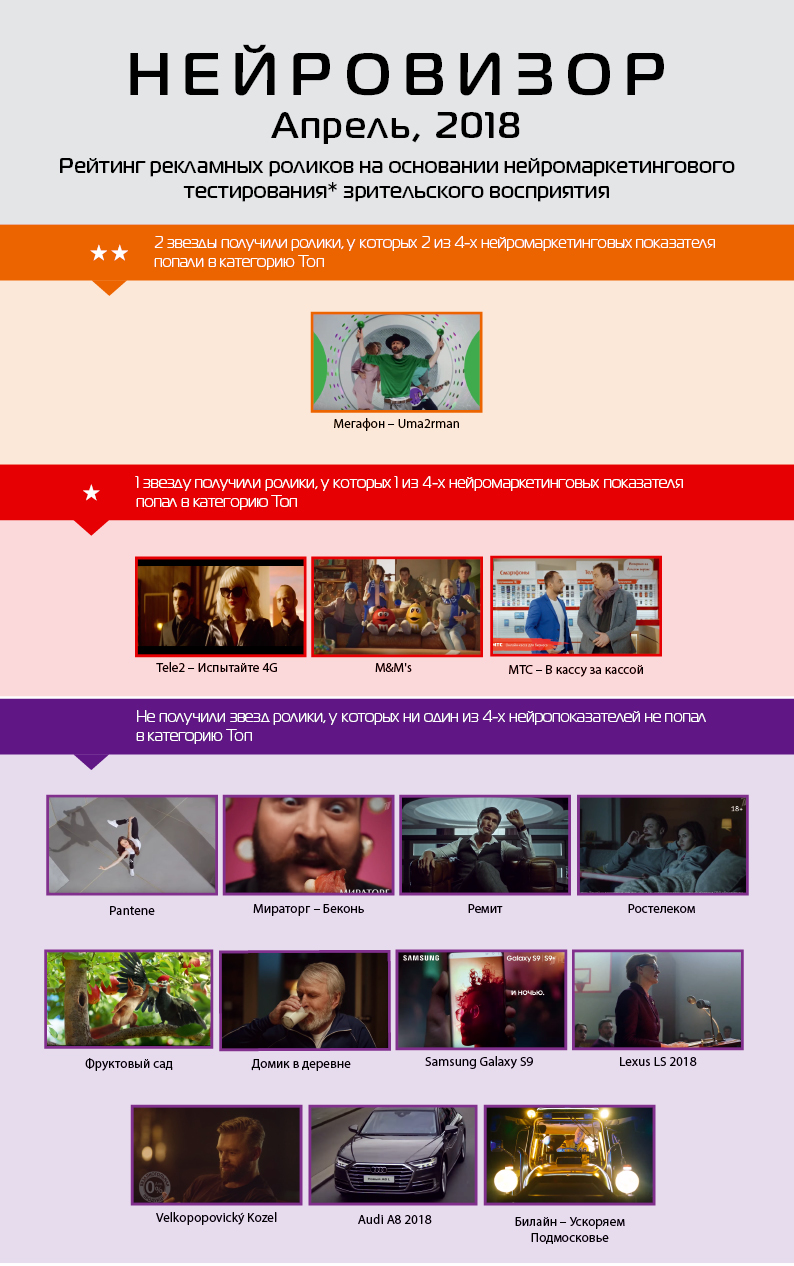
Neurotrend team creates both general rating that reflects general ad effectiveness and separate ratings according to each neuromarketing metric. For each metric an ad can get from 0 to 4 starts and so, the maximum score of one ad is 16 stars. In the end of each rating you can see some comments of our behavioural psychologist, who has also analysed it and gave some explanations of the results.
Neurovisor helps marketing specialists to build the reference system before creating advertising materials. This reference system is based on objective perception of viewers and can help to identify the most effective practices and to avoid the unsuccessful ones. Neurovisor shows the abilities of neuromarketing research approach in assessment of advertising effectiveness.
But it is worth remembering that neuromarketing research potential is much wider. We are able to analyse product packages, retail spaces, websites, videogames and even movies. Neuromarketing researches help us to see strong and weak points of advertising materials and to develop recommendations for improvement. For example, identify on what seconds the audience has lost attention and on the contrary what moments are the most attractive. With this information in hands, the advertiser can cut off some parts of the video, increasing the effectiveness of ad and at the same time decreasing the budget by making shorter the airtime.
Basically, all players of advertising market from clients and marketing specialists to creative department and also those who are interested in advertising and new technologies.
Brands also could compare their performance with the performance of their competitor; marketing specialists could analyse the effectiveness of a stimulus and open the opportunities of neuromarketing in general; creative team could find some working hints and tips for the future; and all other people could take a look on advertising from different perspective. Also, it is worth mentioning that the advanced report and analysis of all advertising in Neurovisor are available on commercial terms.
In 2017 Neurotrend launched a unique project that meant to change the normal routine of advertising market in marketing research and analysis. We understood that to approach such task we had to have a strong data base to build all the analytics. For almost a year our company had been doing internal monthly tests to collect this data base. And when the base had reached 850 ads and when all the neuromarketing metrices had been built – we had the opportunity to offer the ads objective evaluation system to the market. Neurotrend started publishing ratings of 15 new ads on a monthly basis.
During next 10 months we had been analysing reviews and internal processes that revealed weak points that needed to be improved. As a result, we decided to update Neurovisor and in 2018 we launched the new version. That is why you could notice the differences between the old and the new editions. So how does our new assessment system look like?
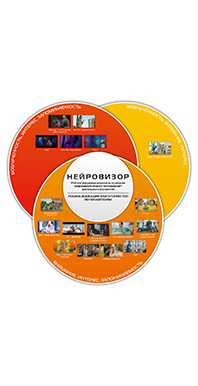
Neurovisor rating is based on 4 neuromarketing metrics: interest, emotional engagement, memory retention and attention. Every metric is measured according to 100 scores scale and could be divided to 5 equal groups – quintiles – from the smallest to the biggest value (every group has it’s colour). Also, every metric has an average value based on all ads tested before. This allows to compare your ad both with the competitors and with the average value.
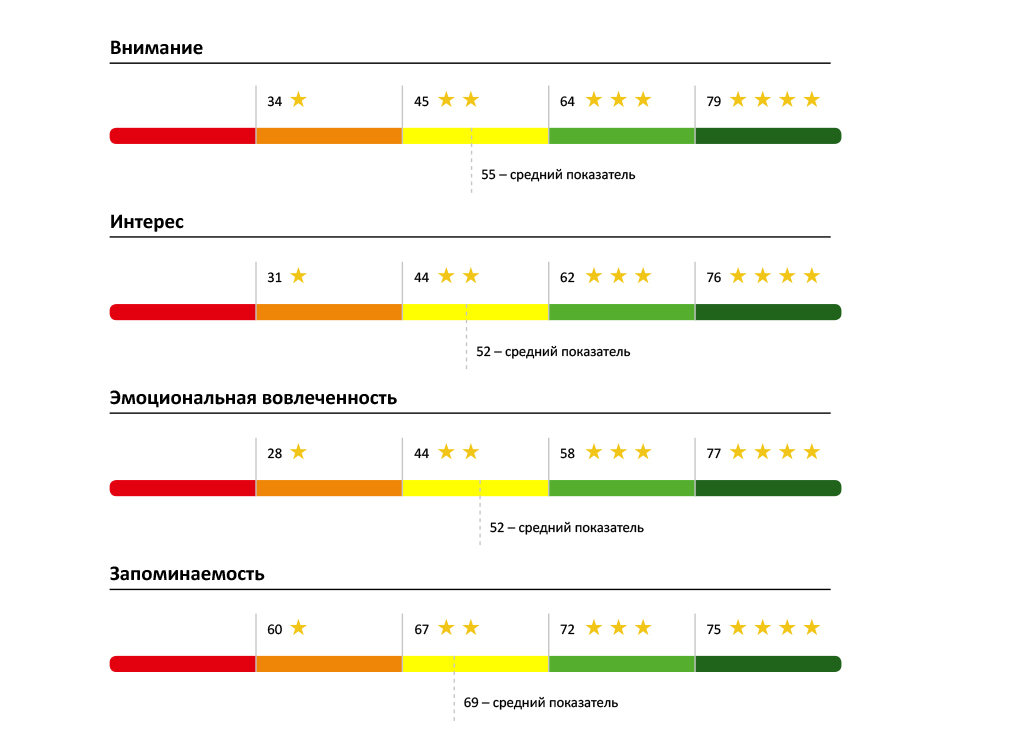
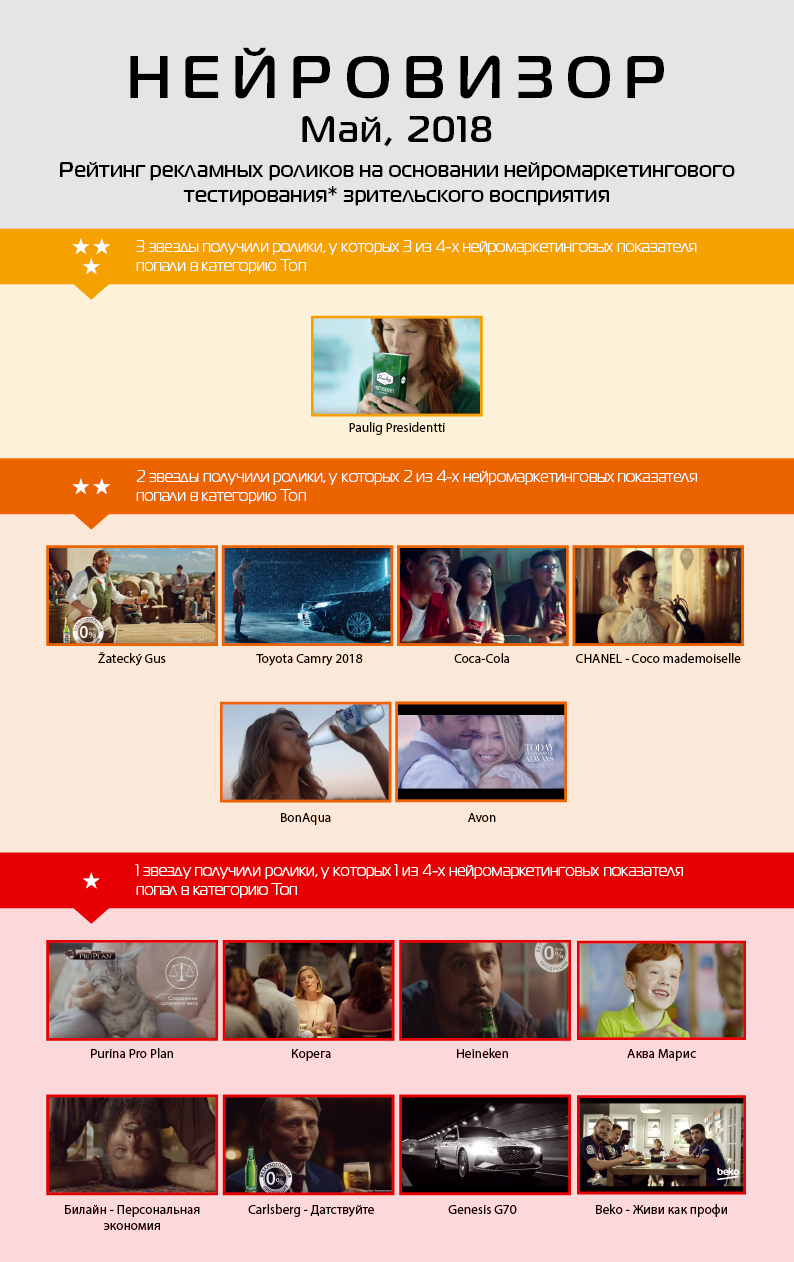
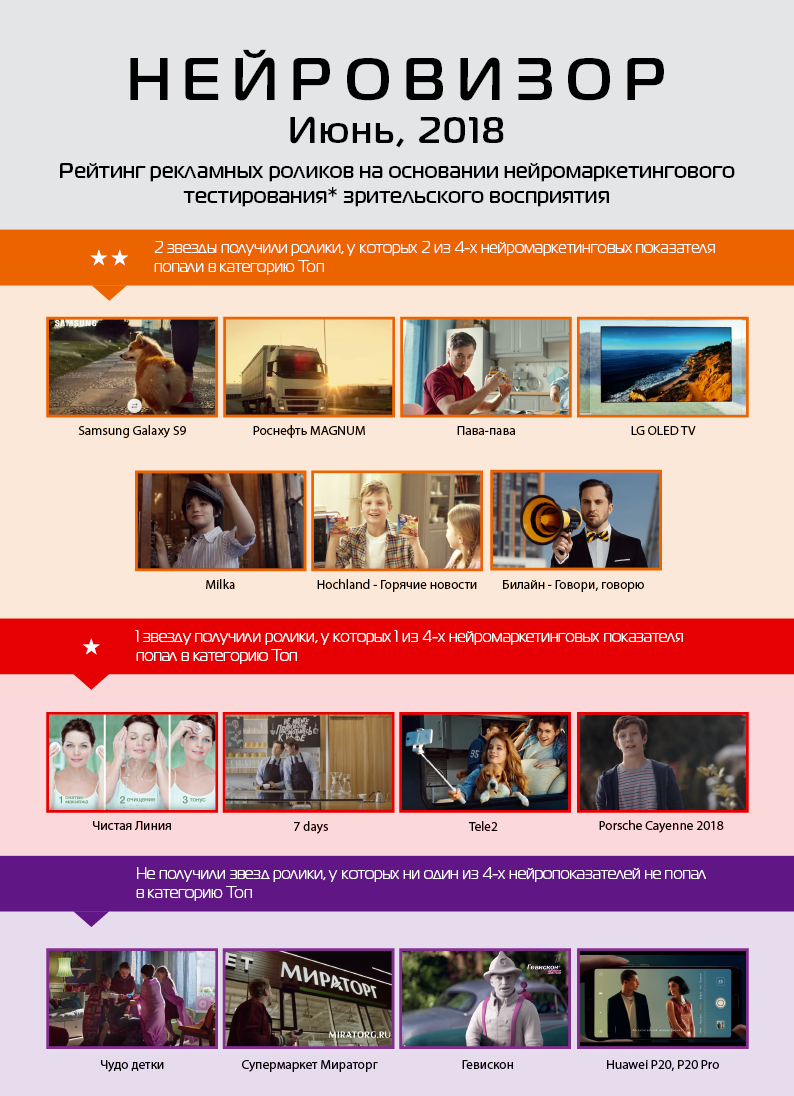
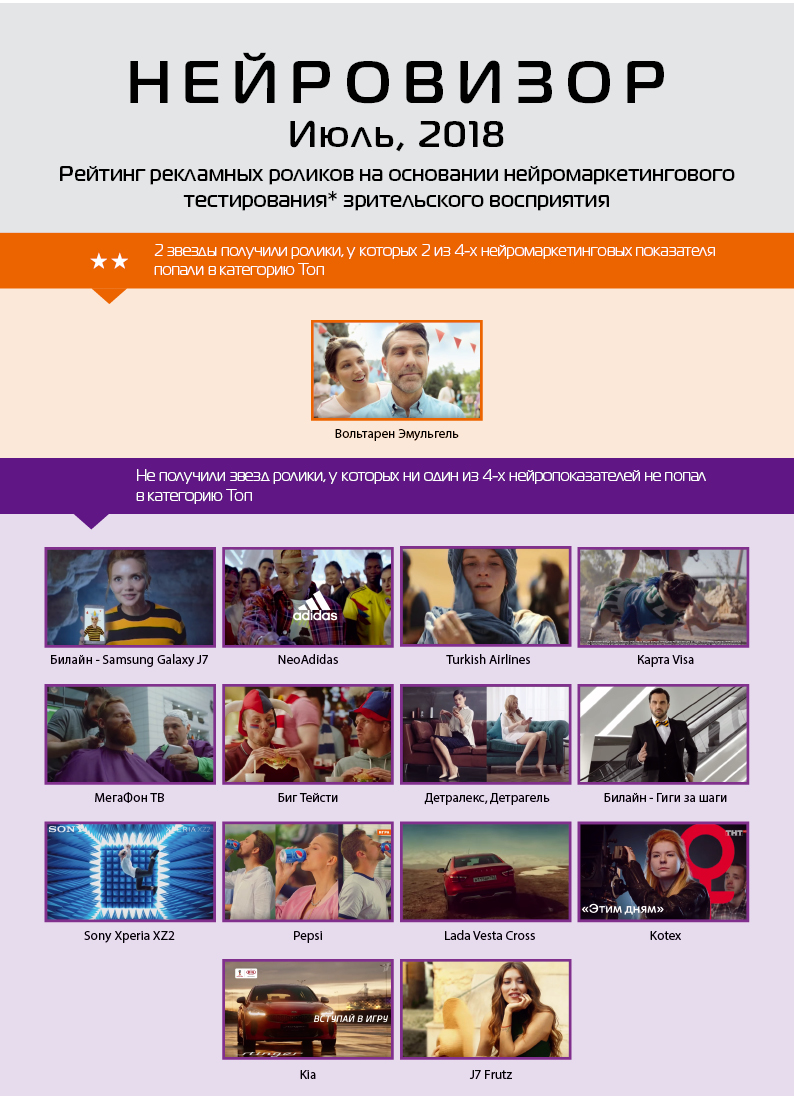
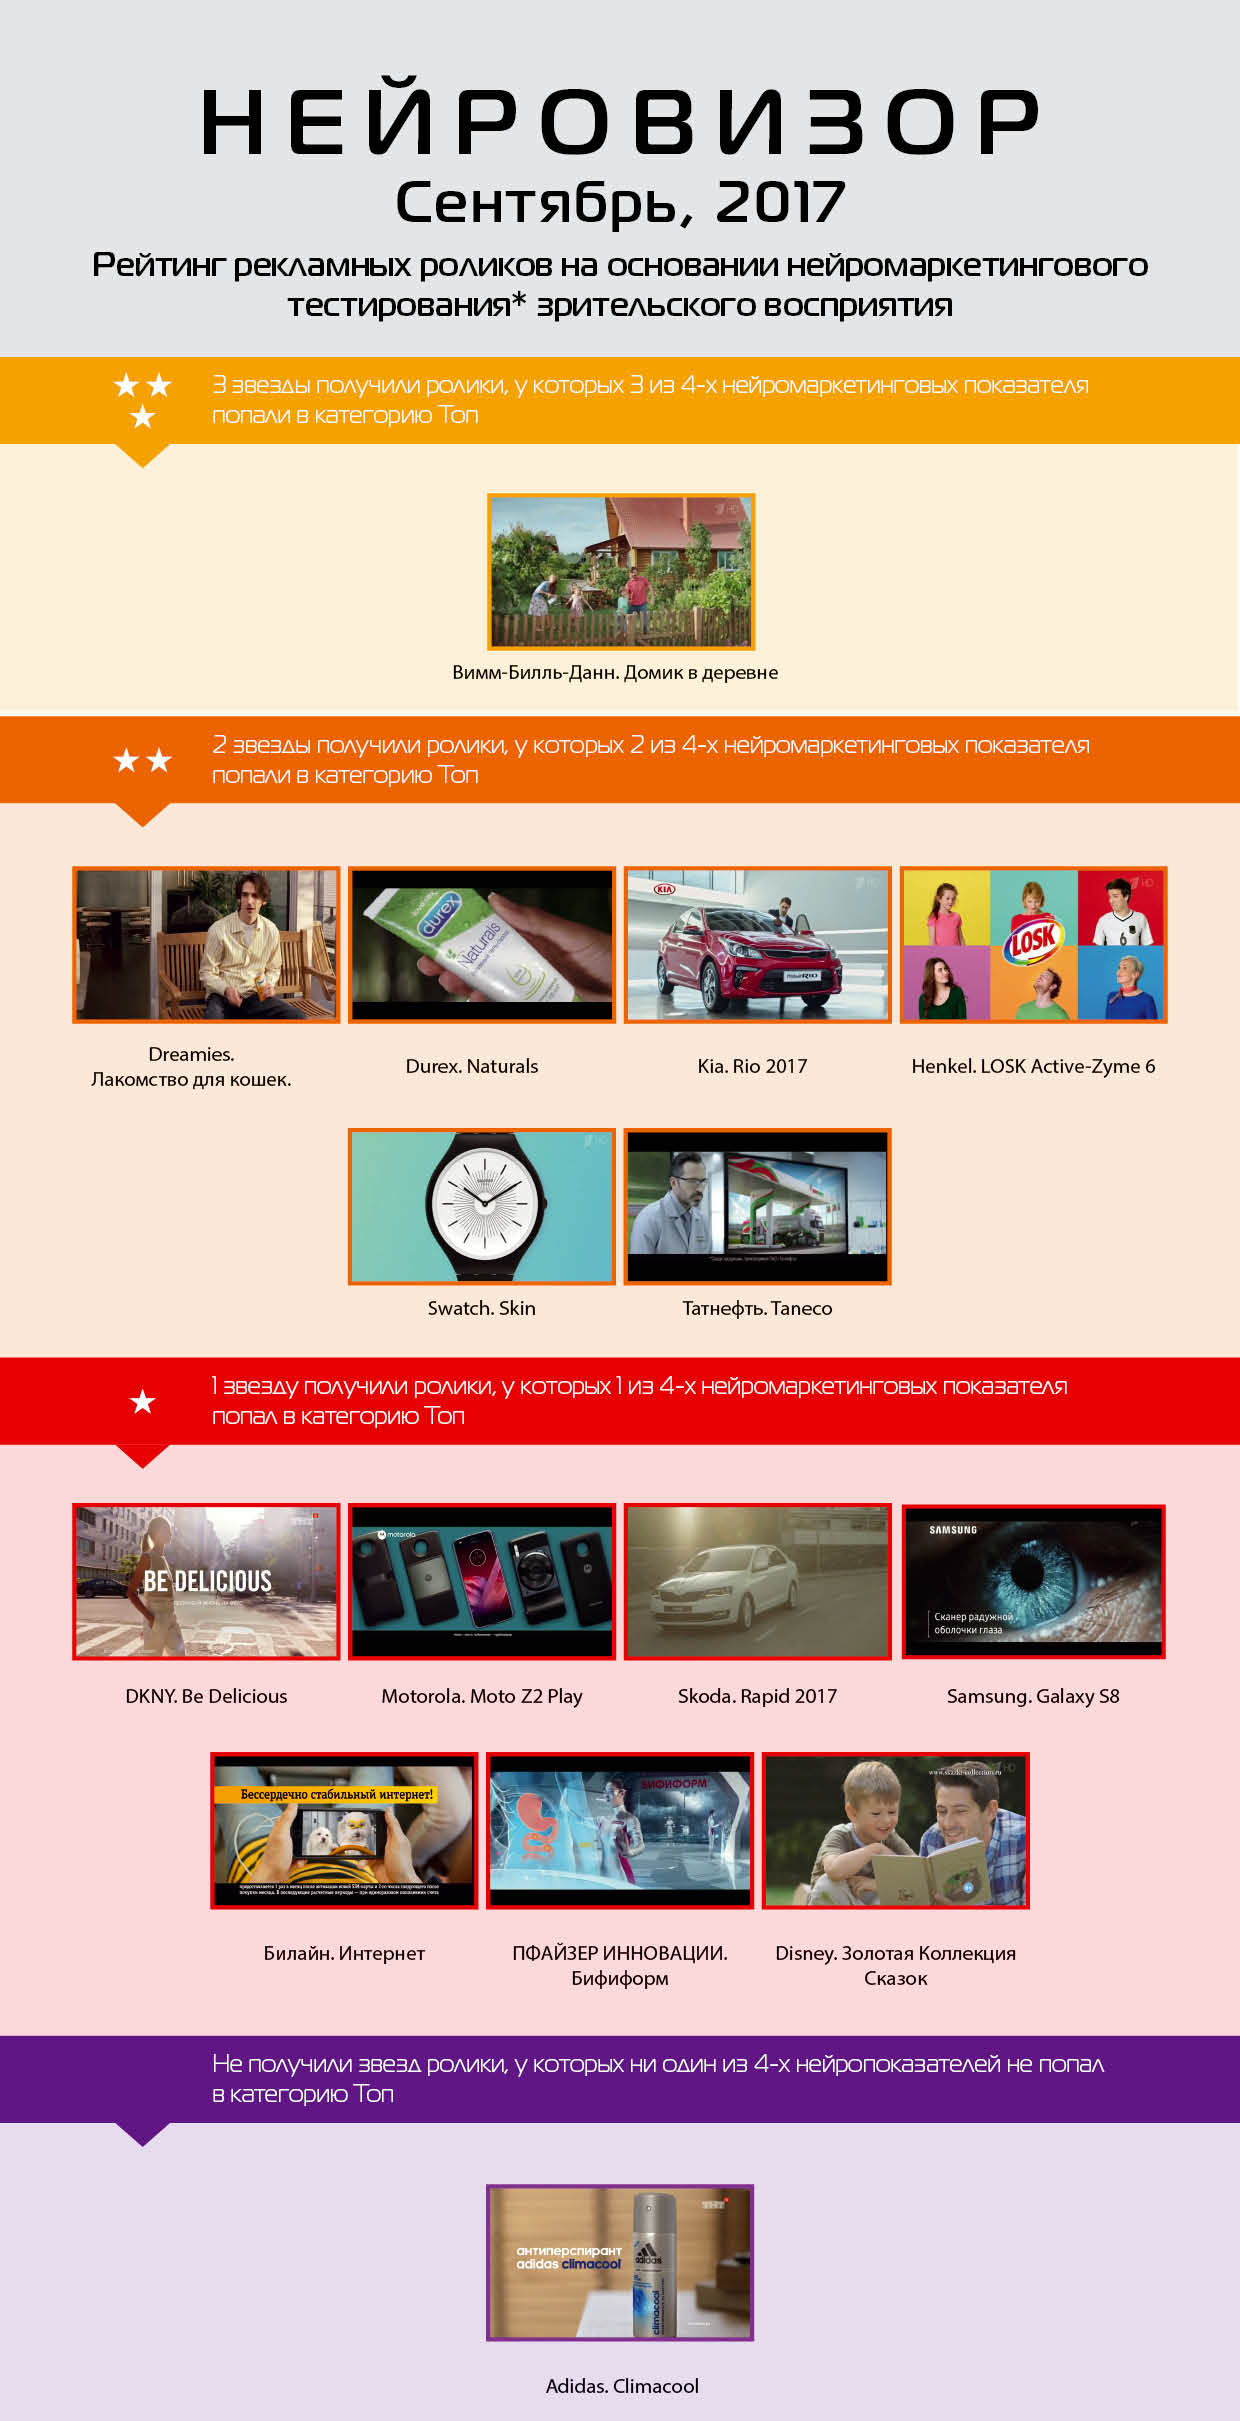
Stars are nominated to each ad depending on being in one or another quintile based on 4 metrics. If the ad is in the first quintile (dark green area), the ad gets 4 stars; if in the second (light green area) – 3 stars; if in the third (yellow area) – 2 stars; if in the fourth (orange area) – 1 star. If the ad is in the lowest quintile (red area), it doesn’t get any stars. Thus, the ad could get no more than 16 stars based on 4 metrics.
Neuromarketing sounds much easier when you are marketing specialist who works with analytics and approach data creatively. But our data in Neurovisor is mass product rather than ad-hoc research, so many our readers asked for “layman explanations” of neuromarketing metrics and our rating. Specialists were also interested in reading detailed review of one ad as a whole. That is why we decided to add to Neurovisor a curious section with the detailed review of one video. Our behavioural psychologist analyses the ad and explains strong and weak points, their mechanics and also episodes that provoked a significant reaction from the audience. Now you could also learn the reasons behind each reaction.
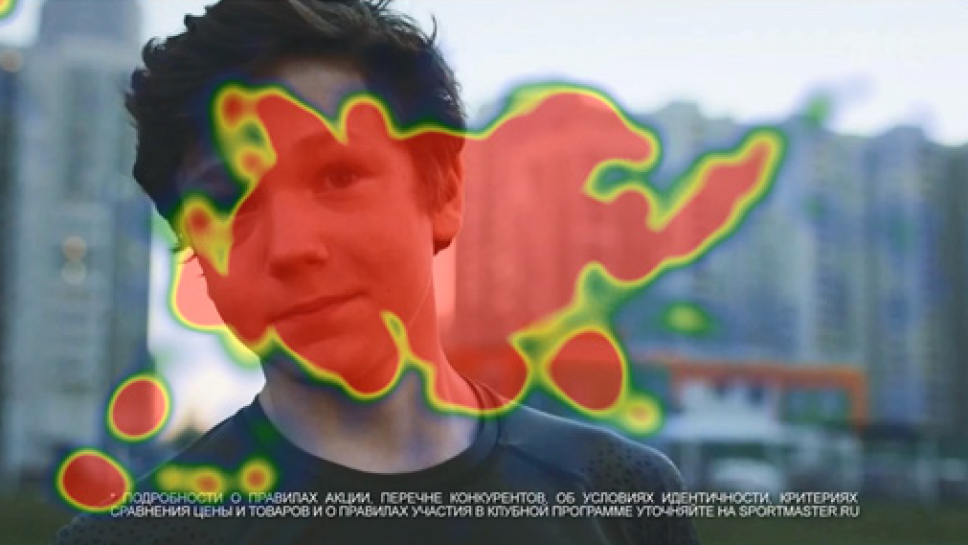
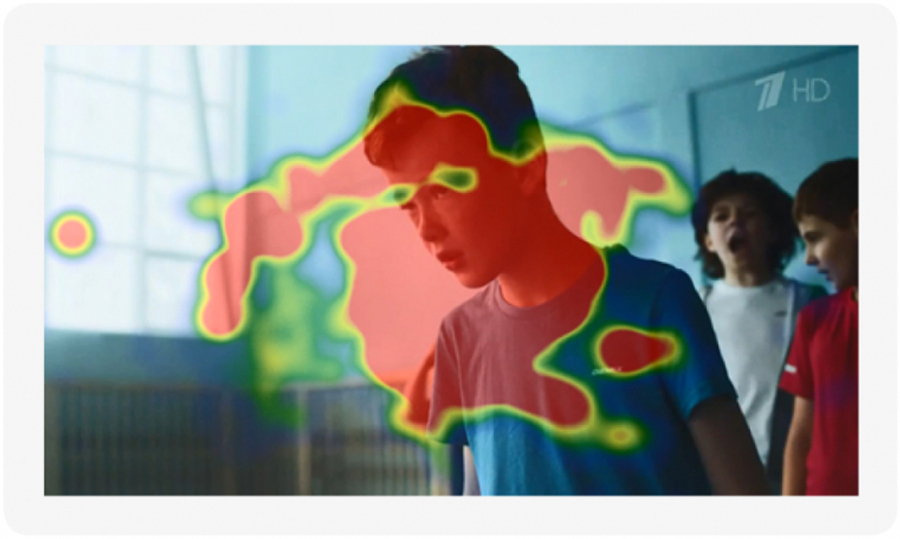
People perceive most of the information through eyes. Certain elements of advertising video such as product, slogan, characteristics and logo have to be noticed by viewers. But what if your bright and colorful picture gets all the attention of viewers so that important information about product specs and favorable deals get lost? In our analysis we pay attention to such issues and give explanation to such episodes.
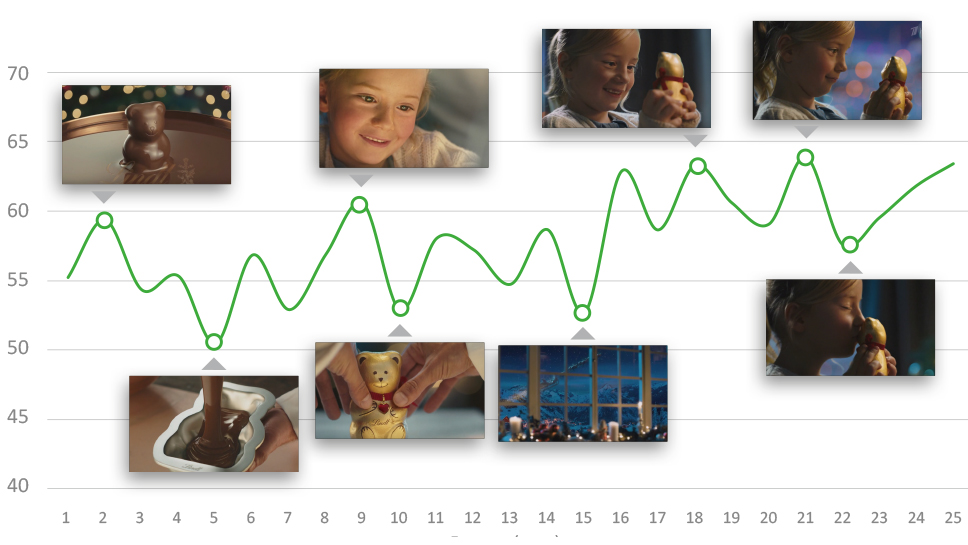
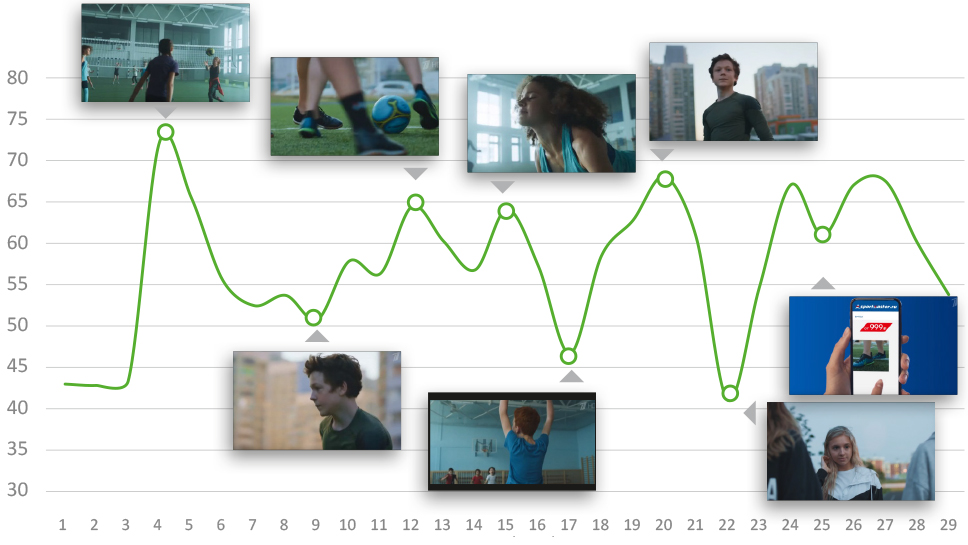
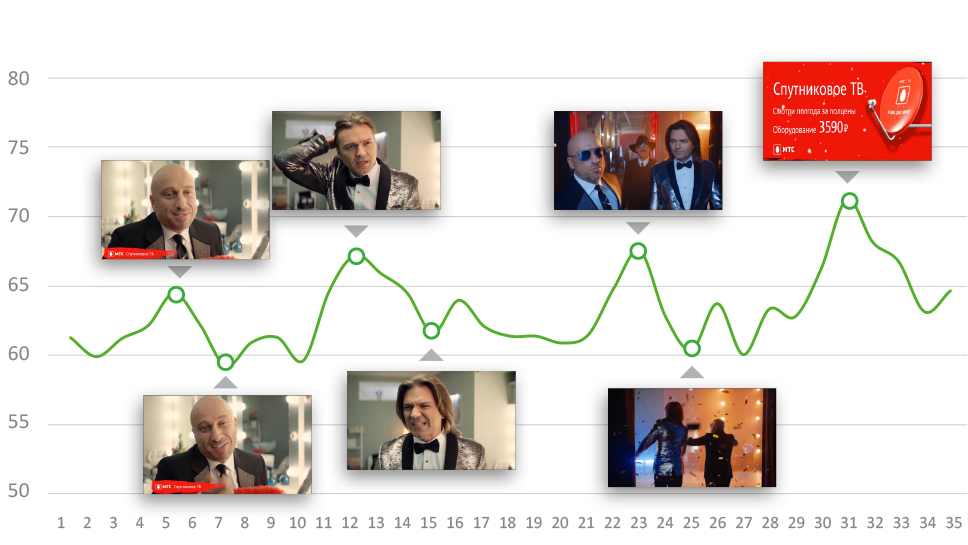
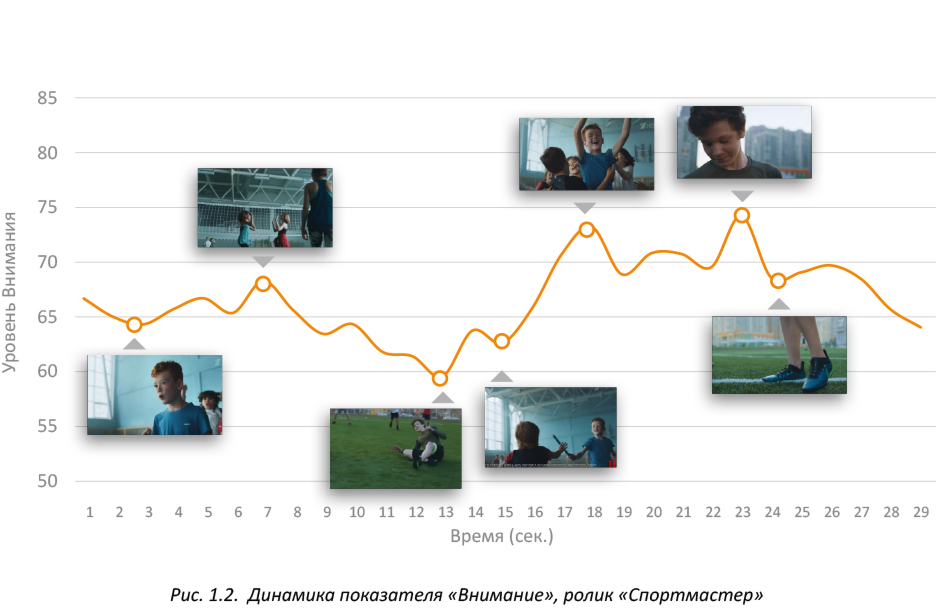
Emotional engagement and attention are two metrics that could be represented in dynamic as a curve. In our new version of Neurovisor we give the chart of these two metrics for the ad that was analysed by our behavioural scientist. So, our readers could see attention and engagement of the viewers in particular episode of the video and what they have seen at the peak of reactions. At the same time, we recommend not to focus on the peaks solely but to see the changes of trend in dynamic because all of our reactions are interconnected.
In the end, we would like to mention that the detailed report and analytics of all the advertising videos in our Neurovisor are available on commercial terms. Due to the fact that Neurovisor now focuses on industry-specific editions, provided information could serve as competitors analysis in certain market. The only difference is that this information is not about the business of your competitors but about your marketing wars on TV each month.